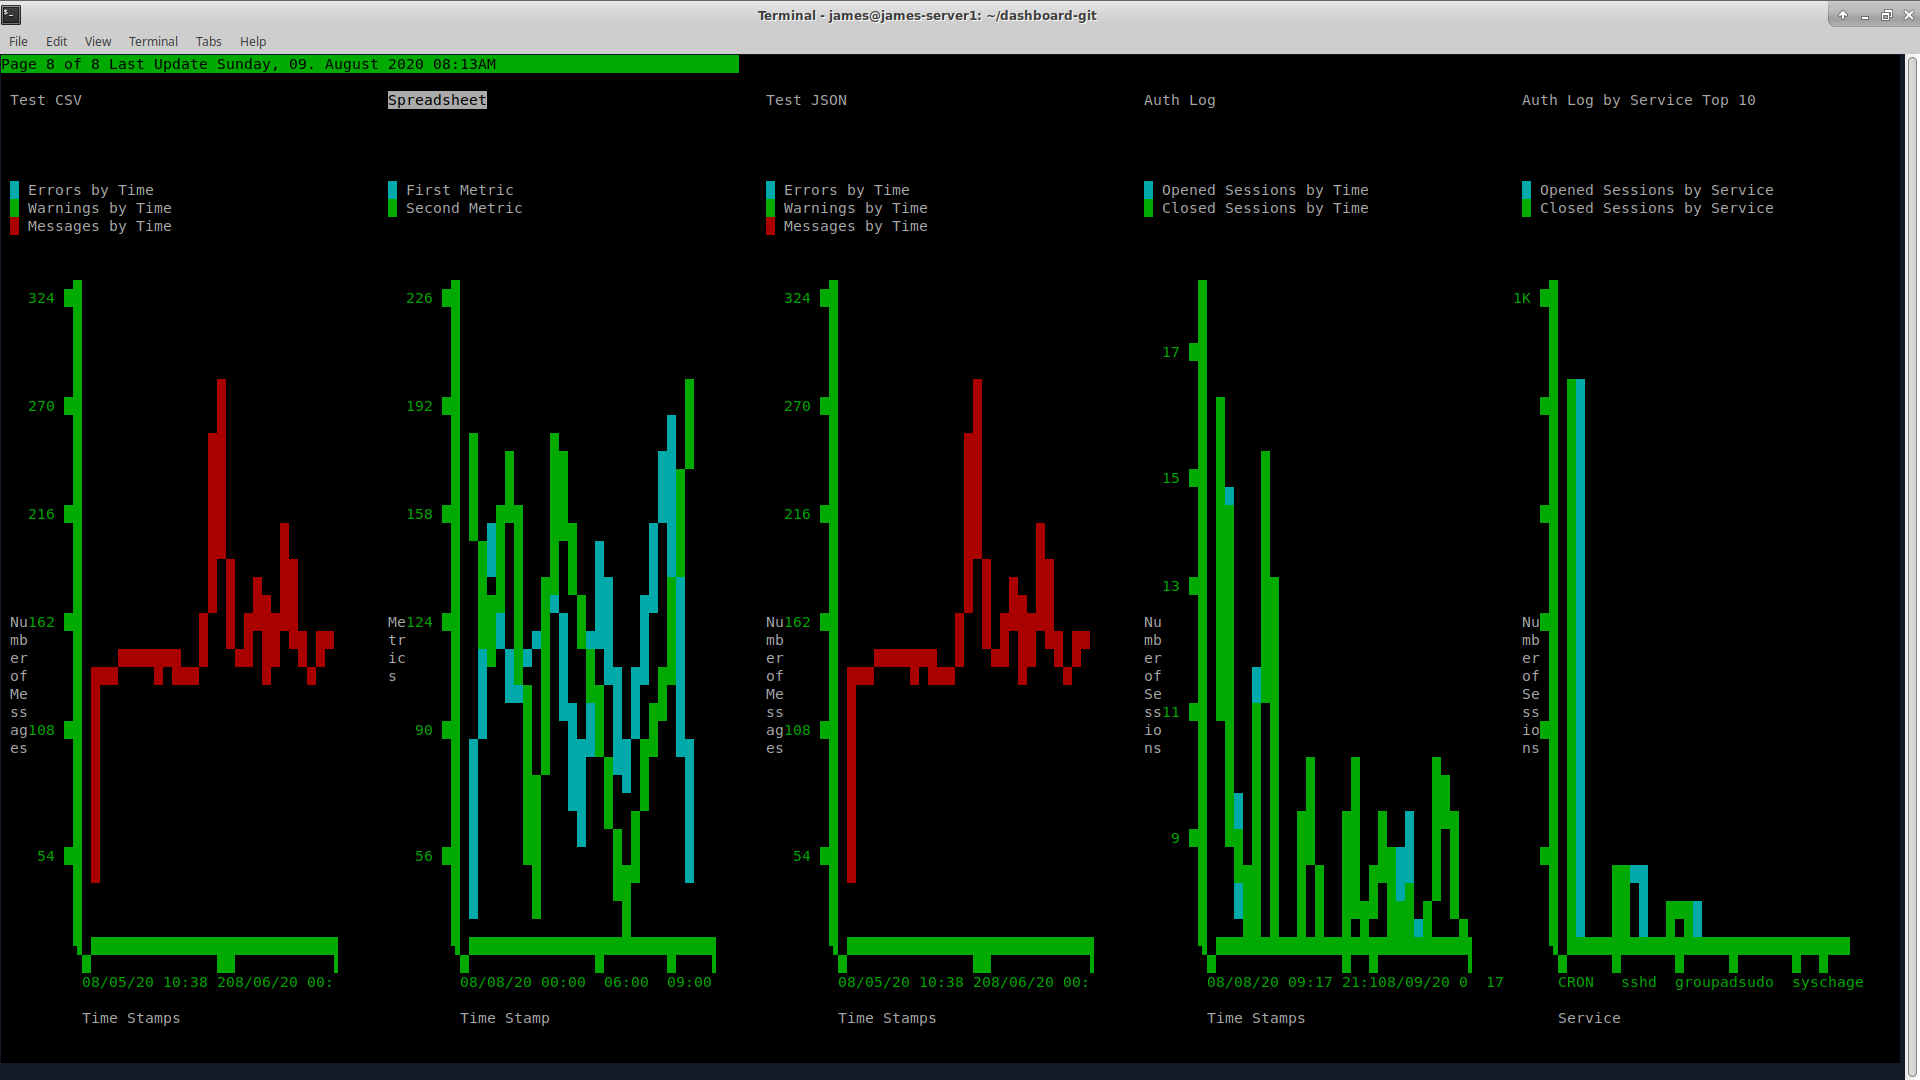
I’ve made a lot of progress on the terminal based dashboard tool that I’ve been working on. It is out there on github now ( https://github.com/jpfxgood/dashboard ) and I’ve made some pre-releases. It is on pypi as well as terminal-dashboard.
The feature set has increased a lot, it handles getting data for graphs from Elasticsearch, ODBC databases, CSV files, JSON files, generic log files, remote systems via SSH. It is integrated with the system keyring so no credentials need to be stored in the config. I’ve improved the rendering and scaling of the graphs a lot, smart shortening labels, shifting stuff slightly to make axis and labels clear, reducing the number of pie slices for clarity, etc… It has a plugin interface for both graphs and data sources, as yet untested… but I’ll get it working…
Next up is writing a test suite for the system and improving the API and user documentation. There are also some minor features like better y-axis scale choices, better format trade offs as the graphs get compressed, performance improvements, check-pointing some of the log readers so that they don’t have to completely reread everything on startup if shut down for a little while, and JSON record format logs…
In the meantime, I’m running endurance tests as well to see if it’s leaking or has any long running bugs…. I still really like the model and architecture, I haven’t had any major refactors and the number of additions and tweaks to the API are rapidly declining… I think the sub-modules for character graphics, graphs, and data tables and data sources are all going to be useful by themselves and I’ve been careful to keep them very decoupled…
I’ll probably do another pre-release next week…
